
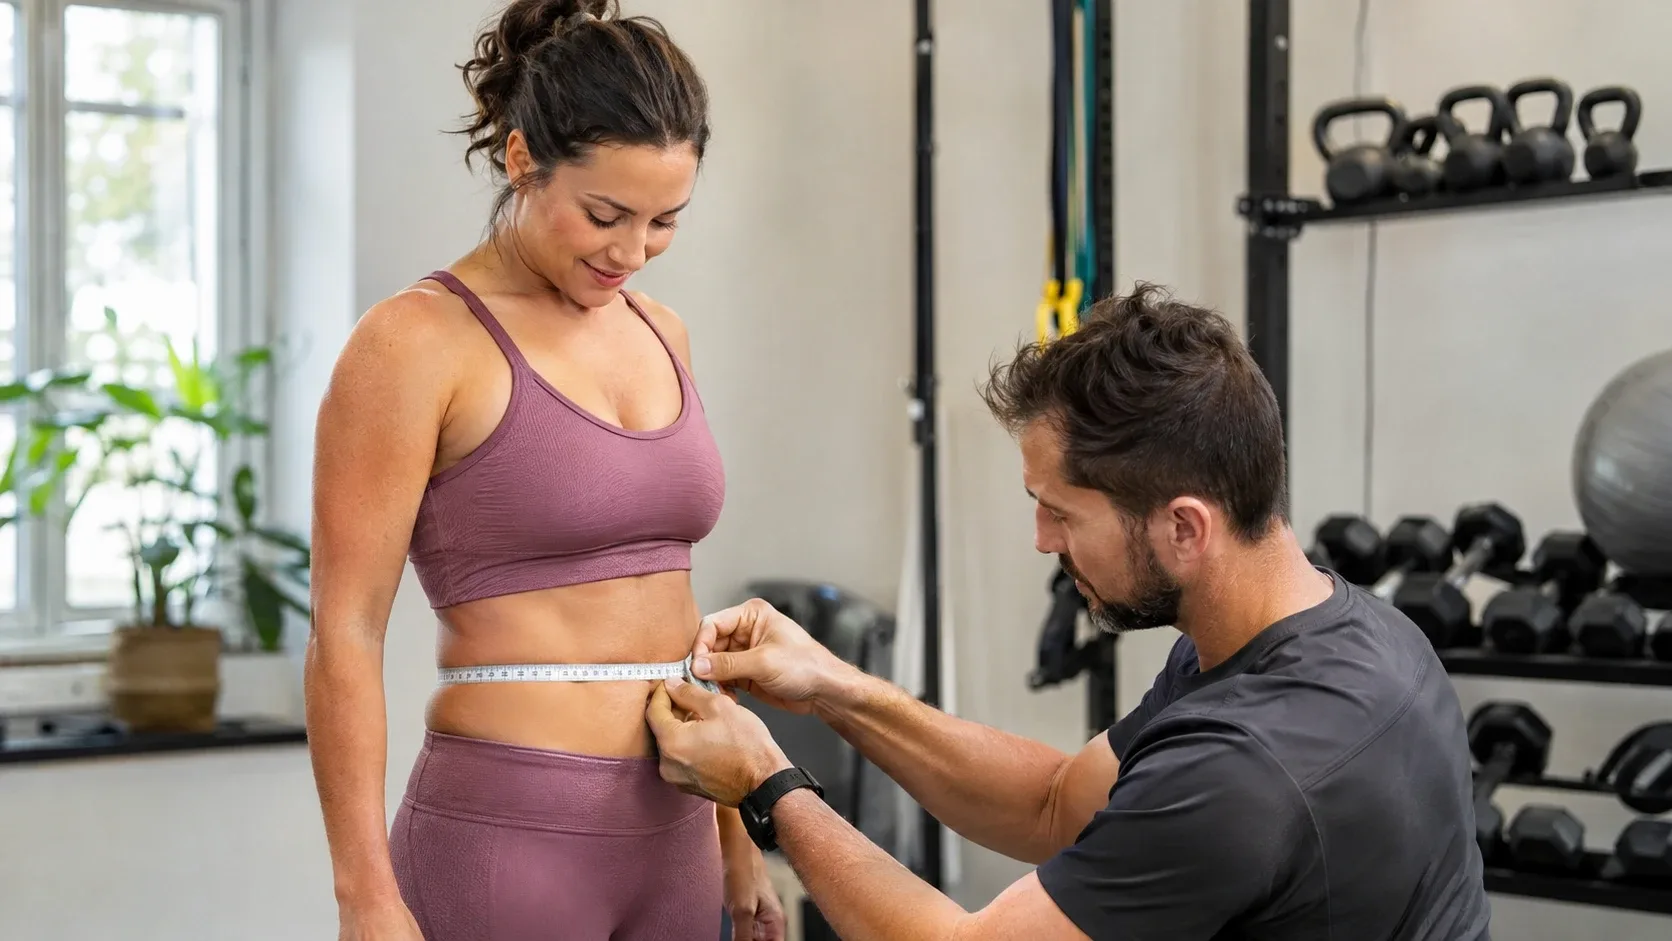
Average body fat isn't the same as a healthy body fat target. A measured average describes a group at the time researchers checked them. It can't tell you what percentage you should aim for, and it doesn't account for differences in muscle, bone, fitness or health.
The best measured US data on average body fat percentage by age comes from the CDC's National Health and Nutrition Examination Survey (NHANES). It used dual-energy X-ray absorptiometry (DXA) scans collected from 1999 to 2004. That's still a useful benchmark, but it's a historical one, not a 2026 snapshot.
What the CDC Measured
The CDC's summary drew on DXA scans from 22,010 people in the US civilian population who weren't living in institutions. DXA estimates body composition by using low-dose X-rays to separate fat, lean tissue and bone. It's not the same as the electrical estimate a bathroom scale gives.
Females had higher average body fat than males at every age. The gap was smallest at ages 8 to 11, at 3.9 percentage points. It widened to 12.0 points by ages 16 to 19.
Measured Average Body Fat by Age
The CDC summary publishes these specific points.
| Group | Average body fat | Data years |
|---|---|---|
| Males, 16 to 19 | 22.9% (lowest male average) | 1999 to 2004 |
| Males, 60 to 79 | 30.9% (highest male average) | 1999 to 2004 |
| Females, 8 to 11 | 32.0% (lowest female average) | 1999 to 2004 |
| Females, 60 to 79 | 42.4% (highest female average) | 1999 to 2004 |
These are the lowest and highest averages the summary reports, not a full table for every age. A complete breakdown would need the detailed NHANES tables and survey weights. We haven't filled in the missing age bands with guesses. Children's and teens' figures also shouldn't be judged against adult standards.
Why Men and Women Differ
Body composition differs between the sexes for biological and developmental reasons, but individuals vary a lot. Group averages shouldn't be used to judge one person's health, looks or fitness. Every average also hides a spread, with many people above and below it.
What Happens Through Adulthood?
The CDC data shows higher average body fat in older age groups. But it was a snapshot of different people at different ages, not the same people followed over time. So it can't tell you how much body fat one person gains each decade.
Changes in muscle and where fat is stored can matter even if your percentage stays the same. And because body fat is a percentage of total weight, it shifts whenever your weight changes.
Measurement Methods Give Different Results
DXA scans, skinfold calipers and smart scales can all give different numbers for the same person.
- Smart scales use bioelectrical impedance, which is sensitive to how hydrated you are.
- DXA has its own calibration and assumptions.
- Calipers depend heavily on the tester's skill.
If your smart scale disagrees with a DXA chart, that doesn't mean the scale is broken. The methods simply work differently. Sweating in a sauna can shift a scale reading too, as our sauna vs steam room guide explains.
Is Body Fat Better Than BMI?
BMI uses only height and weight, so it can't tell fat from muscle. Body fat percentage adds information about what your weight is made of, but it isn't a complete health check either. Neither one shows your blood pressure, blood sugar, heart and lung fitness or strength.
Fitness is one of those missing pieces. Our average VO2 max by age guide covers measured norms for heart and lung fitness.
How to Use Your Own Number
If you're tracking change, use the same method each time, under similar conditions. Avoid big health decisions based on one reading from a consumer device. A clinician can put your number in context with your history and other measures. To track activity alongside body changes, our WHOOP vs Oura comparison covers two popular wearables.
Tracking at home? Our guide to the best body composition scales explains how far smart scale readings can drift from lab methods.
FAQs
What Is the Average Body Fat Percentage for Adults by Age?
It depends on the study year, age groups, sex and method. CDC DXA data from 1999 to 2004 found averages of 30.9% for men and 42.4% for women aged 60 to 79. Those are historical group averages, not personal health targets.
Does Body Fat Increase With Age?
In the CDC data, older age groups had higher average body fat. But because different people were measured at different ages, the data can't show how fast any one person's body fat changes over time.
Is a Smart Scale as Accurate as a DXA Scan?
They use different technologies. Smart scales estimate body fat indirectly and are sensitive to hydration and the device's formula. DXA is a different method with its own limits. Use one method consistently and get a professional opinion if a decision depends on it.
Is Lower Body Fat Always Healthier?
No. A single percentage can't decide your overall health, and very low body fat can be harmful for some people. A proper assessment looks at symptoms, activity, diet, medical history and other measures, not one number from a chart.
Sources
- CDC, QuickStats: Mean Percentage Body Fat, by Age Group and Sex: NHANES, United States, 1999–2004, MMWR 2008.
- CDC, National Health and Nutrition Examination Survey.
- MedlinePlus (National Library of Medicine), Body Mass Index. BMI may not reflect body fat in very muscular people.
Only the age groups published in the CDC summary are shown. No modern averages or personal targets were invented. This article gives general information, not medical advice.